Ranking YC Companies with a Neural Net
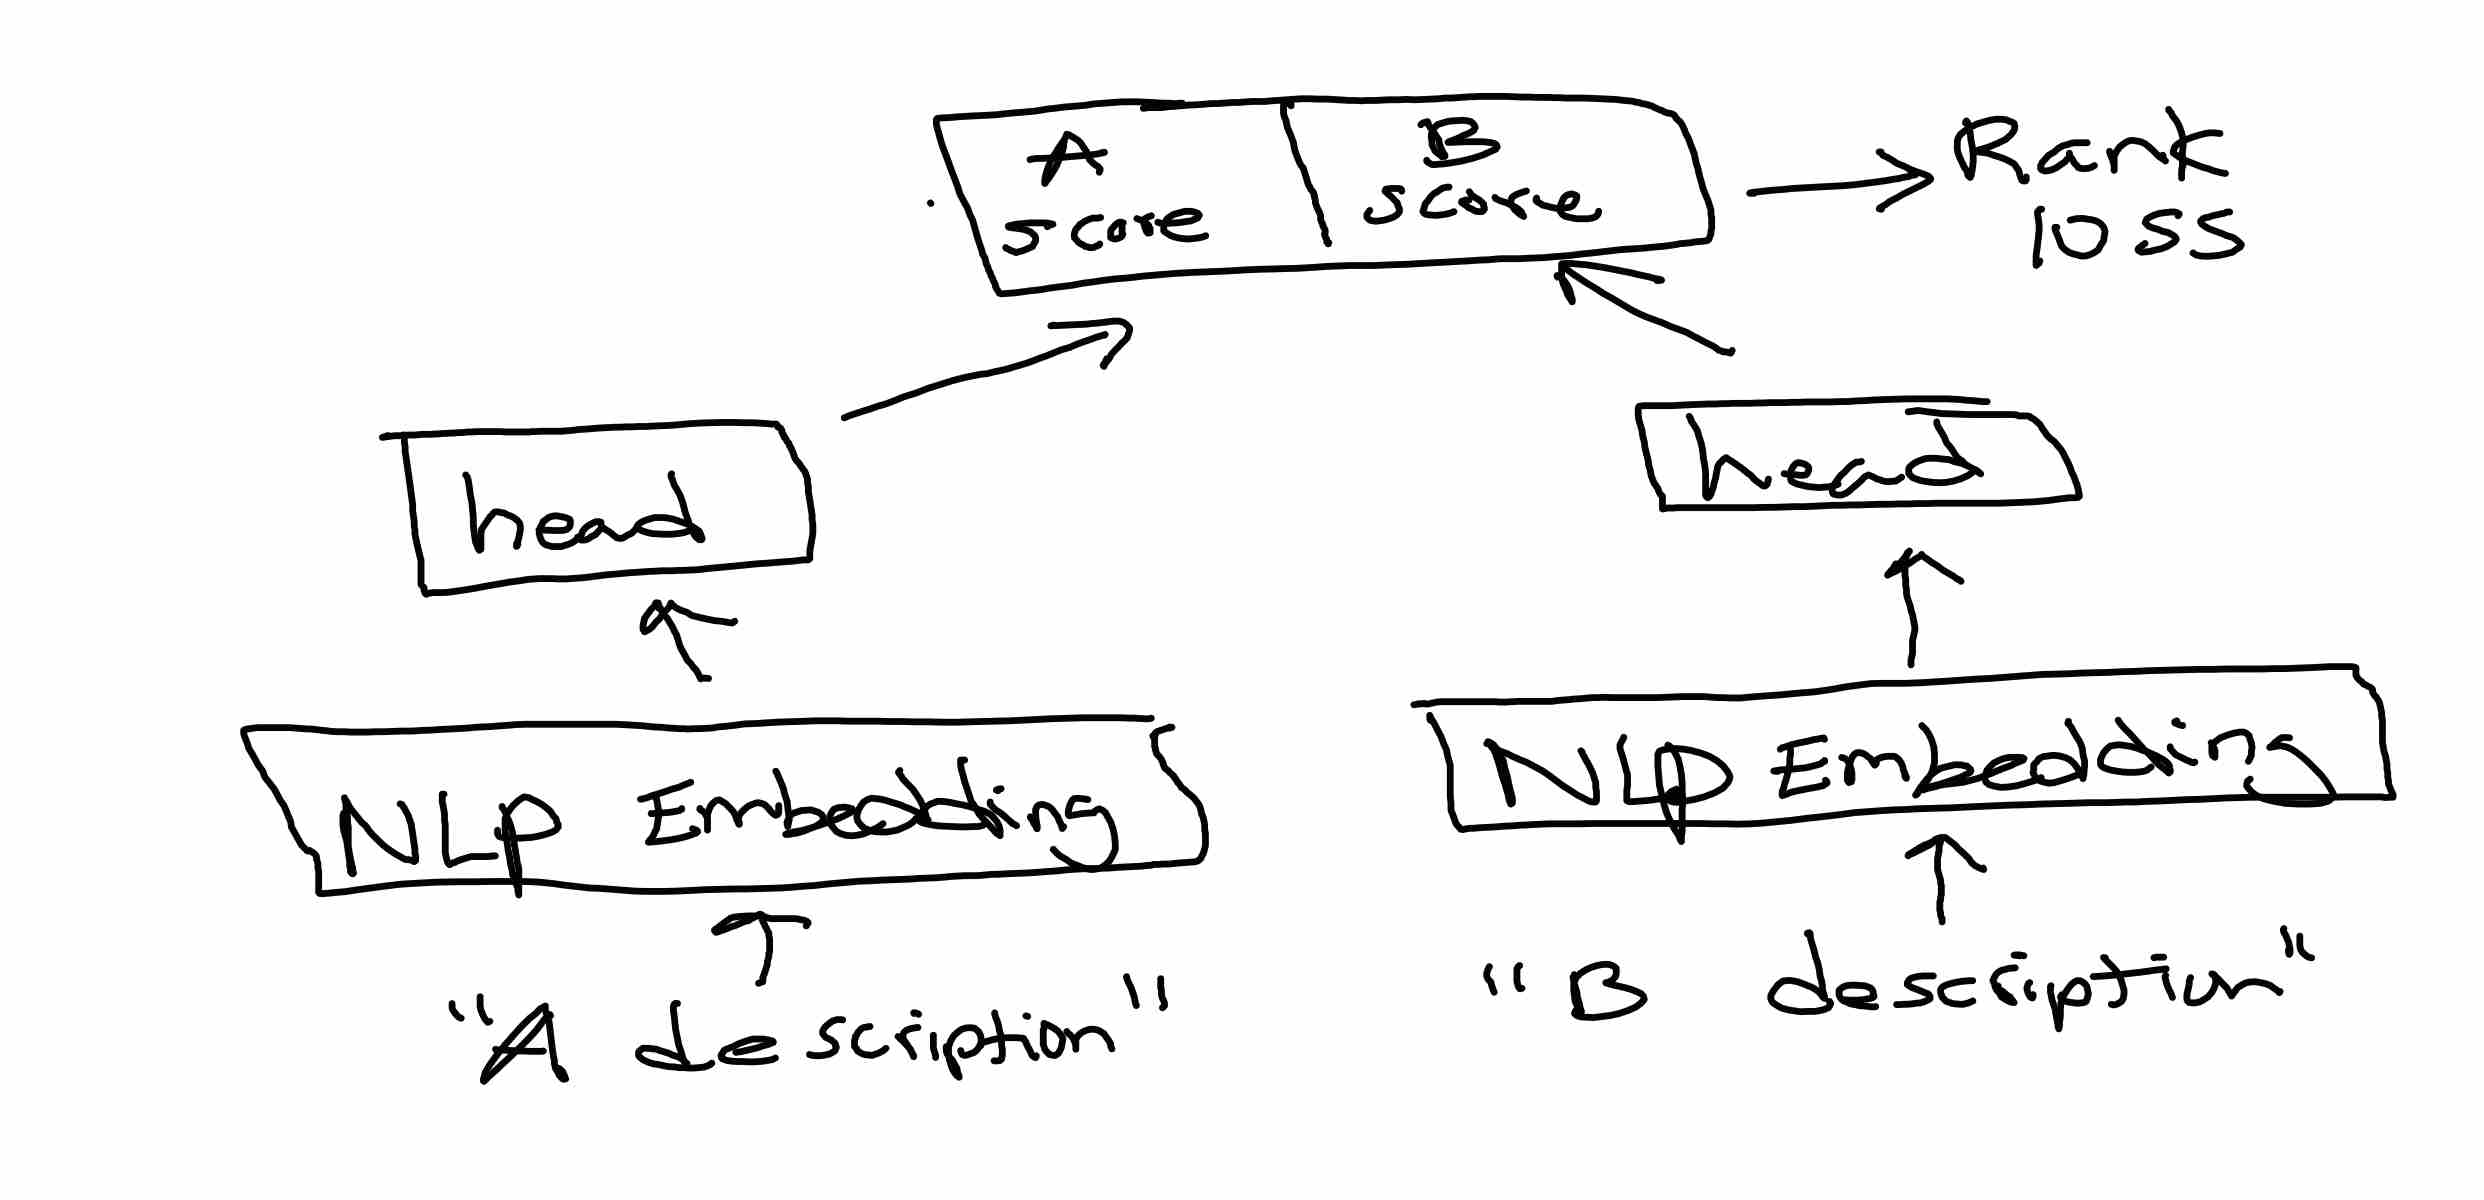
I made a neural network, YCRank, trained it on a handful of hand-labeled pairwise comparisons between YC companies, and then used it to sort the companies in the most recent W'22 batch.
There are 397 companies in the recent YC 2022 Winter batch. Which ones should you invest in?
Suppose a seed investor's entire worldview and investment framework can be distilled into how they uniquely sort this large collection of startups by target portfolio weights. To sort the list, the investor has to perform at least 396 comparisons (in the best possible case), but O(N log2 N) comparisons in the worst case, which sums up to about 3428 bits provided by human judgement. That's one expensive sort!
Can we shrink our estimate of the upper bound of the Kolmogorov complexity of a seed investor? To investigate this, I made a neural network, YCRank, trained it on a handful of hand-labeled pairwise comparisons, and then used the learned comparator to sort the companies in the most recent W'22 batch.
Disclaimer: Please don't take it personally if your company ranks low on this list, this is more of a proof-of-concept of how to train models to reflect one person's opinions. The ordering deliberately ignores a lot of things, and by construction does not consider important analyses like product-market fit, founding team strength, and technological edge. The current YC Rank model predicts ordering from a miniscule amount of context. You can take solace in that I'm not a particularly great investor: if you invert this list you might actually do quite well.
Model Inputs
YCRank takes as an the input natural language description of a company. Here is what the raw JSON metadata for each company on https://www.ycombinator.com/companies looks like:
{'id': 26425,
 'name': 'SimpleHash',
 'slug': 'simplehash',
 'former_names': [],
 'small_logo_thumb_url': 'https://bookface-images.s3.amazonaws.com/small_logos/2ed9dc06a8e2160ef441a0f912e03226a6ba9def.png',
 'website': 'https://www.simplehash.com',
 'location': 'San Francisco, CA, USA',
 'long_description': 'SimpleHash allows web3 developers to query all NFT data from a single API. We index multiple blockchains, take care of edge cases, provide a rapid media CDN, and can be integrated in a few lines of code.',
 'one_liner': 'Multi-chain NFT API',
 'team_size': 2,
 'highlight_black': False,
 'highlight_latinx': False,
 'highlight_women': False,
 'industry': 'Financial Technology',
 'subindustry': 'Financial Technology',
 'tags': ['NFT', 'Blockchain', 'web3'],
 'top_company': False,
 'isHiring': False,
 'nonprofit': False,
 'batch': 'W22',
 'status': 'Active',
 'industries': ['Financial Technology'],
 'regions': ['United States of America', 'America / Canada'],
 'objectID': '26425',
 '_highlightResult': {'name': {'value': 'SimpleHash',
   'matchLevel': 'none',
   'matchedWords': []},
  'website': {'value': 'https://www.simplehash.com',
   'matchLevel': 'none',
   'matchedWords': []},
  'location': {'value': 'San Francisco, CA, USA',
   'matchLevel': 'none',
   'matchedWords': []},
  'long_description': {'value': 'SimpleHash allows web3 developers to query all NFT data from a single API. We index multiple blockchains, take care of edge cases, provide a rapid media CDN, and can be integrated in a few lines of code.',
   'matchLevel': 'none',
   'matchedWords': []},
  'one_liner': {'value': 'Multi-chain NFT API',
   'matchLevel': 'none',
   'matchedWords': []},
  'tags': [{'value': 'NFT', 'matchLevel': 'none', 'matchedWords': []},
   {'value': 'Blockchain', 'matchLevel': 'none', 'matchedWords': []},
   {'value': 'web3', 'matchLevel': 'none', 'matchedWords': []}]}}
I simplified the JSON string to remove redundancy, and removed status, top_company, highlight_black, highlight_latinx, highlight_women, regions to avoid potential bias. This doesn't necesssarily absolve YCRank from bias, but it's a reasonable start.
YCRank examines abbreviated descriptions like the one below to predict a logit score, which is then used to sort against other companies.
'SimpleHash'
'Multi-chain NFT API'
'Financial Technology'
['NFT', 'Blockchain', 'web3']
('SimpleHash allows web3 developers to query all NFT data from a single API. '
 'We index multiple blockchains, take care of edge cases, provide a rapid '
 'media CDN, and can be integrated in a few lines of code.')
'team size: 2'
Data Labeling
Carefully designing the dataset with the right choice of train/test split is 80-90% of the work in building a good ML model. I started by comparing a subset of companies from np.random.choice(393, size=200, replace=False) to a randomly chosen company from np.random.choice(393, size=1, replace=True) (an extra 4 companies got added after Demo day). I then split this into a training set of 155 examples and a test set of 48 examples. This means that at test time, the model is comparing unseen pairs of companies. Most of the companies it will have seen in at least one example, but some companies will never be seen at all.
To make the model easier to debug, I biased my ranking towards what was "harder to execute" on, especially in scenarios where I felt both companies were equally uninteresting. This is not how I would actually invest as an angel, but rather just makes it easier to debug whether the model is capable of picking up on this pattern.
I also tended to rank favorably companies that were already making monthly recurring revenue with double-digit growth rates. There are other ways to rank pairs of companies - one could imagine a variety of prediction heads that rank by "founder ambition", "high chance of complete failure", "atoms over bits", "probability of being acquihired", "socially good" etc.
Modeling
The model is a modified RobertaClassificationHead on top of RoBERTa embeddings. Because the number of training examples was fairly small I got a decent boost (+10% accuracy) tuning hyperparameters and employing a variety of regularization tricks.

Data Labeling with Active Learning
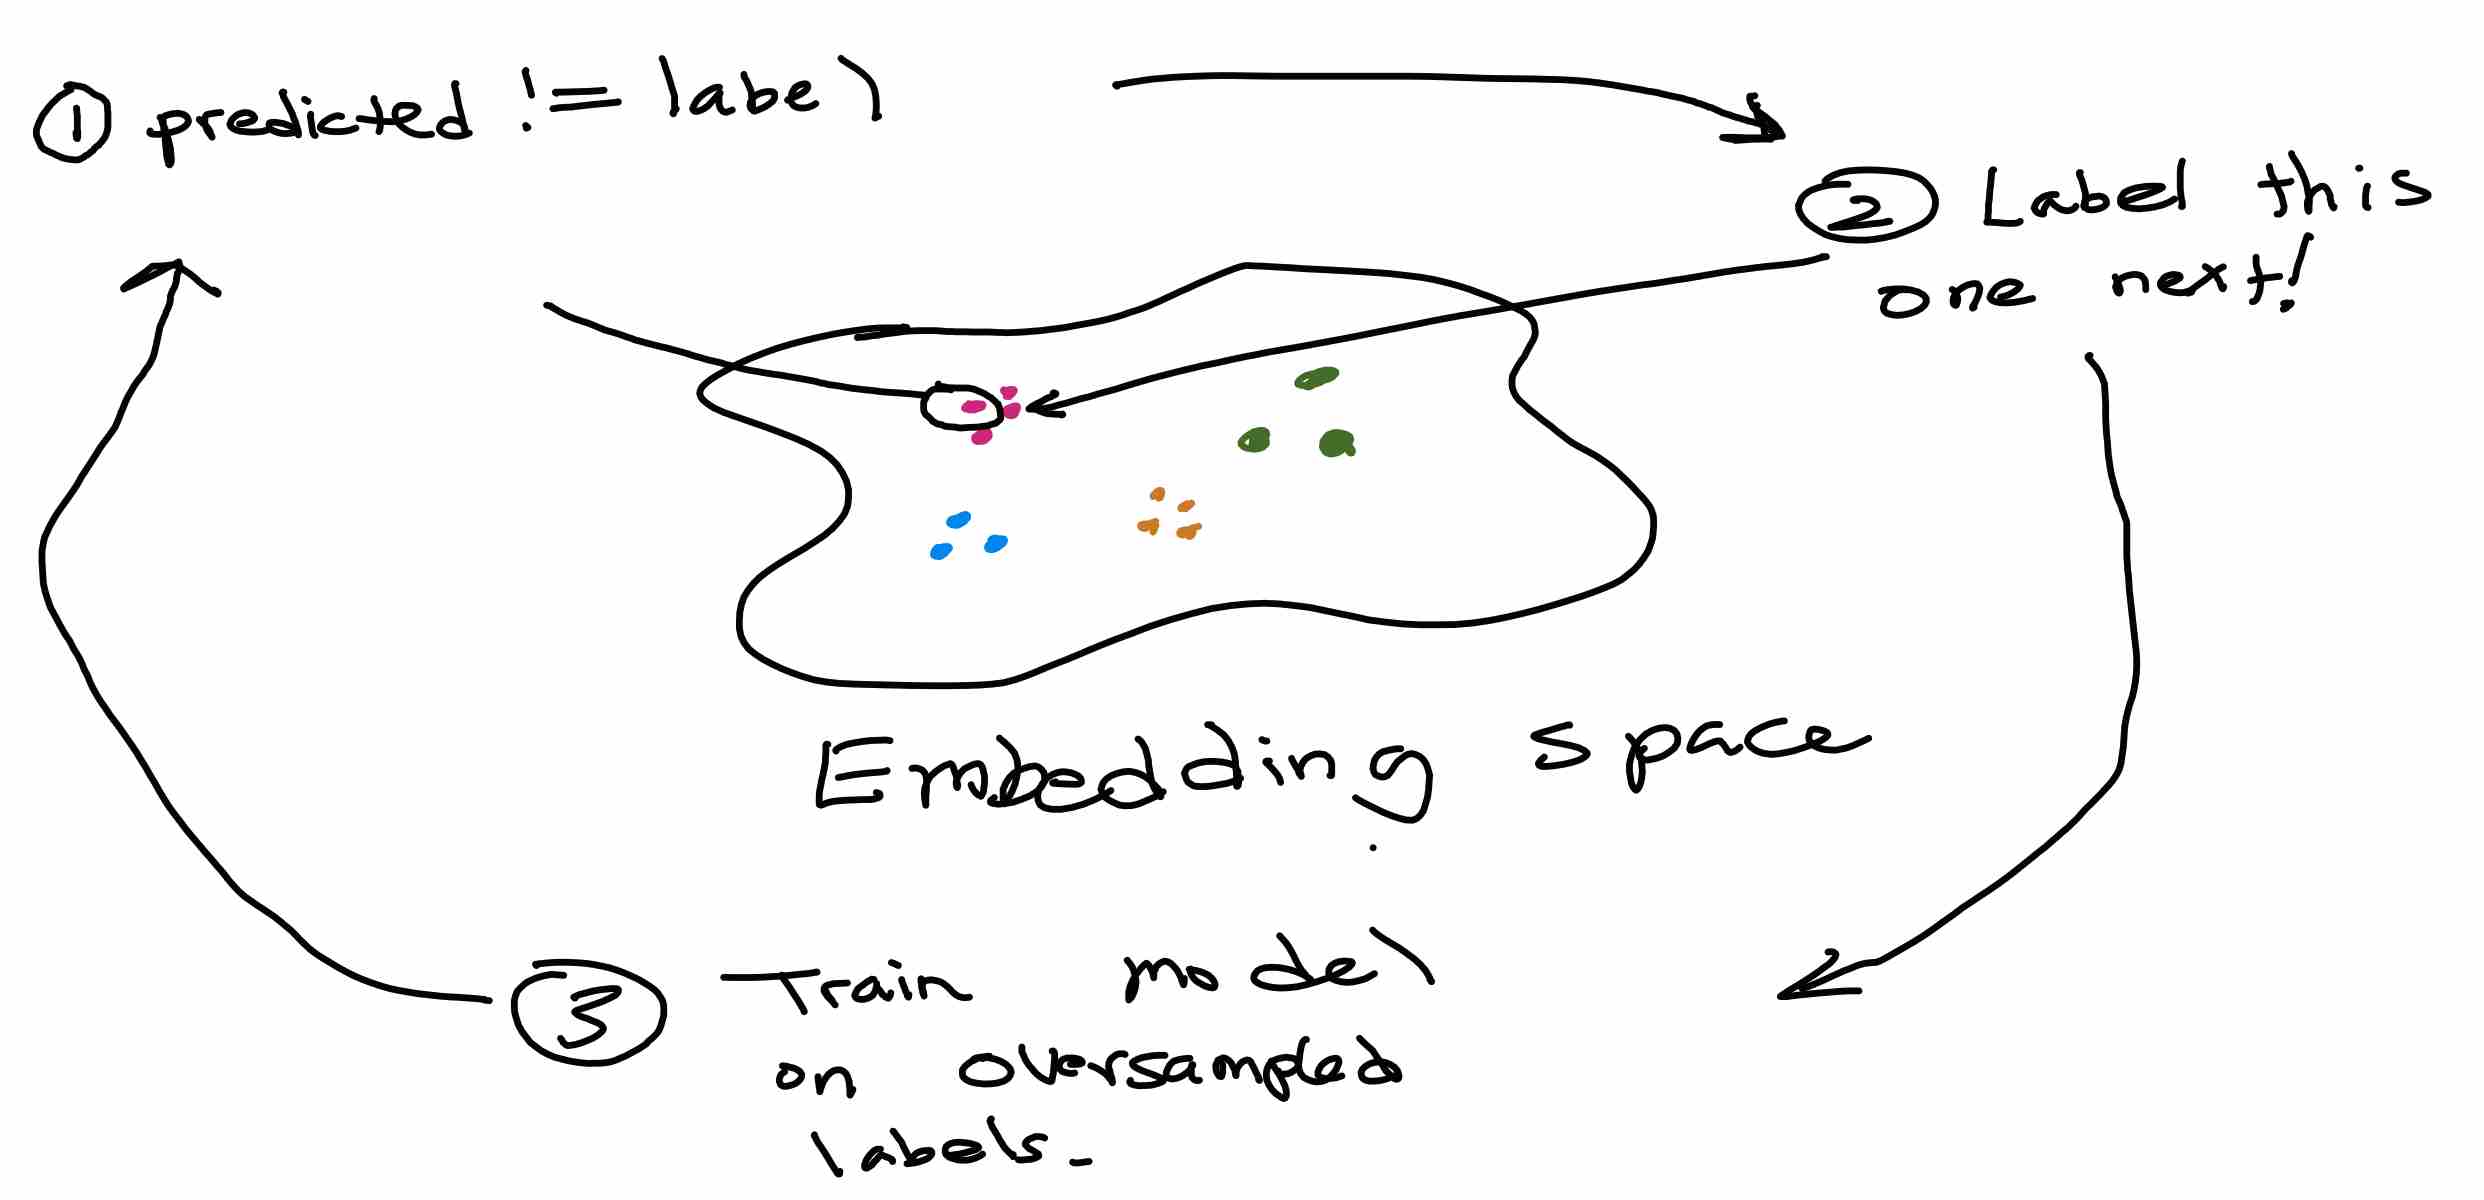
Neural network have learned "hidden" representations with which you can use to cluster data. You can combine it with an active learning scheme to have the model "help you decide what to label next". This means that you can quickly find the examples that your model tends to perform badly at, and then label those to make the errors go away.
The Tesla AutoPilot team employs a similar idea in their "data engine" flywheel to help them surface more examples that their vision system tends to performs less well on. As the model gets better, the embedding space also gets better at surfacing relevant "hard examples" by matching the semantic content of the images better.

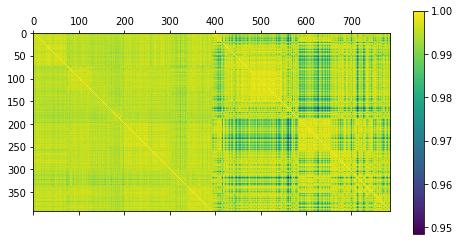
Here is a cosine similarity matrix of the company embeddings, grouped together via a spectral decomposition for ease of visualization. On the left are the RoBERTa embeddings - you can see some faint block structure but all the NLP similarities are quite high (> 0.99). On the right are the spectral clustering of the hidden layer embeddings of the RobertaClassificationHead. Because this hidden layer is explicitly trained for the downstream "Eric rank prediction" task, it unsurprisingly separates better into more distinct clusters by cosine distance.

It's not a big deal that the cosine similarities are close to each other, since we'll use the relative ordering of scores to determine our active sampling scheme. A cursory examination suggests that the embedding is learning to group by sector. For example:
'WhiteLab Genomics'
'Unleashing the potential of DNA and RNA based therapies using AI'
'Healthcare'
['Gene Therapy', 'Artifical Intelligence', 'Genomics']
('We have developed an AI platform enabling to accelerate the discovery and '
 'the design of genomic therapies such as Cell Therapies, RNA Therapies and '
 'DNA Therapies.')
'team size: 13'

Most similar company in the batch:
-----------------------------------
'Toolchest'
'Computational biology tools in the cloud with a line of code'
'B2B Software and Services'
['Drug discovery', 'Data Engineering', 'Developer Tools']
('Toolchest makes it easy for bioinformaticians to run popular computational '
 'biology software in the cloud. Drug discovery companies use Toolchest to get '
 'analysis results up to 100x faster.\r\n'
 '\r\n'
 'We have Python and R libraries that customers use to run popular open-source '
 'tools at scale in the cloud. Toolchest is used wherever their analysis '
 'currently exists –\xa0e.g. a Jupyter notebook on their laptop, an R script '
 'on an on-prem cluster, or a Python script in the cloud.')
'team size: 3'
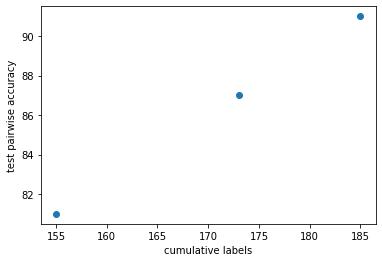
Using these embeddings, I wrote a very simple ML-assisted data labeling algorithm to help me find companies pairs that would correct mistakes in the test set, without actually adding the exact test pair into the dataset. I did this step twice, and each time added about 15 examples. After two iterations, a total of an additional 30 labels boosts the test accuracy from 81% to 91%!

Results
Satisfied with the test accuracy, I used YCRank to read all the YC pitches and sort them. Here they are, along with the predicted logit scores. The scores are not normalized in any way, so they are only useful for comparing one company to another.

Some observations:
- I only read about 200 companies worth of descriptions to build the training set, but the model has still learned to reasonably rank the companies I didn't look at. For instance, I never sampled Posh, Phase Biolabs, Origami Therapeutics, or Brown Foods while labeling the data, but they show up with the other "hard tech" companies feature highly on the list despite being distributed across a number of different industry attributes.
- I was very intrigued by Strong Compute while reading, but it seemed to be rated pretty low.
- I invested in one of the companies prior to building YCRank. It ranked in the 100-150s range 😅. Oops. I did think that the companies immediately above and below it were adequately ranked, so that was pretty cool.
- I confirmed that the lowest-ranking companies were indeed not that interesting to me - mostly fintech. In the middle of the pack was a large swath of B2B SaaS startups that made me want to throw myself off a cliff when reading their descriptions.
- It will take me some more time to understand if there were any interesting false positives / negatives in this ranking, so I'd appreciate if my readers can point out anything interesting. There may be many limitations yet-undiscovered about this model, and I'm quite sure that the model is overfitting to coarser statistics rather than a deep understanding of comparative investment.
Want to Try it Out?
This model could be helpful to people in a few ways.
- Triaging New Opportunities: A new batch of 300+ YC companies show up every 6 months, so having a ML model help you pre-sort opportunities without relying on sector tags will save the investor a lot of time.
- VC Performance Benchmarking: You can measure the mean average precision (MAP) of your YCRank ordering compared to various benchmarks: (1) peer group average ordering at demo day (2) by post-facto valuation (3) indexing uniformly.
- Uncovering Biases: It can be illuminating to know if your investment preferences exhibit implicit biases, e.g. p(invest|
highlight_women=True) differs from your expectations or any of the benchmarks in the previous point. - Founders: For founders, it may be interesting to know how to craft your pitch to boost your YCRank. YCRank currently trains on one person's data, but it is trivial to extended to a user-conditioned setting. You could have the model predict "would Peter Thiel invest in this?" A user-conditioned ranking model will also uncover a "VC embedding space" that clusters VC behavior together.
- Does my VC Add Value?: For LPs, it might be interesting to know what the Kolmogorov complexity of your GPs are. If the GP had a complexity of 1 bit, they had better make up for it in deal flow!
- Adding more data sources: Thanks to modern NLP models like Transformers, they can easily handle all sorts of extra data, such as hiring announcements on Hacker News. As the amount of data increases, the cost per pairwise comparison bit goes up a lot so it's nice to have a ML model to help reduce fatigue.
It's natural to wonder whether such machine learning models can eventually automate venture investment itself, but it's a bit too early to say. Machine learning holds up a mirror to human behavior, knowledge, and sometimes, prejudice. Even if we had a perfect mirror of behavior, said behavior might not be the best one, and we have an opportunity to do better than just automate the status quo. Therefore, it's practical to first use these ML models to help humans make decisions, before thinking about more ambitious automation goals.
If you're interested in trying this model out, please reach out to eric@jang.tech for beta access. I intend to code up a proper website for people to train their own YCRank networks, but want to spend a few more days making sure there are no embarassing failure modes.
Appendix
-
Debugging tip #1: Active learning algorithms require a human in the loop, which can make it expensive to run carefully controlled experiments and debug whether the human-in-the-loop ML is implemented correctly. This was definitely a huge pain when working on bc-z. When developing active learning systems, it's helpful to implement an "oracle comparator" that does not require an actual human to perform the task. If the network can memorize the mapping from company description to a logit that monotonically increases with id, then it should be able to achieve a high accuracy on held-out pairs.
-
Debugging tip #2: To unit-test my NLP embeddings and spectral clustering code, I also concatenated 8 strings from one of my blog posts, to check if the NLP embedding space distinguishes
Distribution(Eric's writing)fromDistribution(YC pitches). Indeed, they indeed have slightly lower cosine similarity (0.98) and show up as a distinct blue band. -
Debugging Tip #3: A lot of junior ML practitioners spend too much time fiddling with network architectures and regularization hyperparameters. If you want to see whether regularization would help, just test your model on a synthetic data problem, and see if scaling up dataset size produces the intended effect. Oracle labelers (see tip 1) are also super useful here.